Company Updates
The Great Halloween Candy Debate
Instacart shares spooky insights about Halloween’s most bewitching candies
The spookiest time of the year is just around the corner which means people are starting to plan their Halloween costumes and fill their trick-or-treat baskets with candy galore. If you’re wondering whether candy or costumes reign supreme, you might be spooked!
According to a recent Instacart survey of 2,063 Americans conducted online by The Harris Poll, nearly 3 in 4 Americans (73%) celebrate Halloween, and among those who do, more than half say candy is more important to them than costumes on Halloween (54%) if they had to choose. Instacart grocery data also backs up our love for candy when it comes to how much we’re ordering. Last year, Instacart customers purchased more than 2.5 million pounds of candy in the weeks leading up to October 31.
“With candy at the center of Halloween festivities, it should come as no surprise that 43% of all candy purchases in October take place during the last week of the month according to Instacart data,” said Laurentia Romaniuk, Instacart’s Trends Expert. “What’s actually spooky is that October 31st is the peak day for Halloween candy purchases as many households scramble to get ready for trick-or-treaters. Luckily Instacart can deliver Halloween candy in as fast as 30 minutes if you find yourself in a scary pinch!”
When it comes to the types of Halloween candy Americans are scooping up and adding to their candy bowls, here are the top purchased candies from last year that we can expect to see filling baskets again soon:
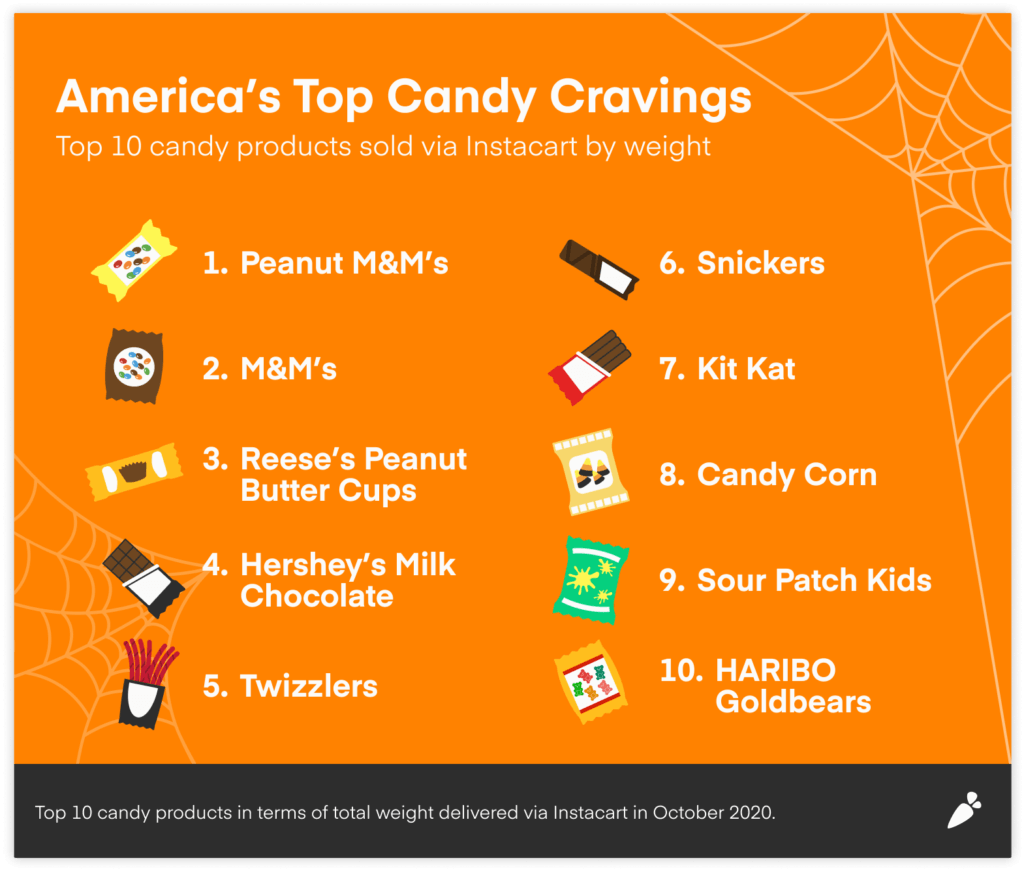
It’s the orange M&M’s for us – The top two most popular Halloween candies in America are Peanut M&M’s and M&M’s in terms of total candy weight sold via Instacart. Let’s face it, in addition to being a bite-sized chocolate delight, the black and orange M&M’s can also add a festive touch to any candy bowl!
Chocolate > everything – With six of the top ten candies featuring rich, chocolatey flavors, it’s clear that Americans have a sweet tooth for creamy milk chocolate.
Love it or hate it. Candy corn takes the #8 spot in terms of popularity, but according to our survey, nearly 1 in 4 Americans (16%) say candy corn is the worst Halloween candy. This begs the question – do we only buy it for the sake of tradition?
The Most Popular Halloween Candies in America
We dipped into Instacart’s purchase data featuring hundreds of candy products to reveal the most uniquely popular Halloween candy in each state. All we have to say is, are you Team Twizzler or Team Red Vine?
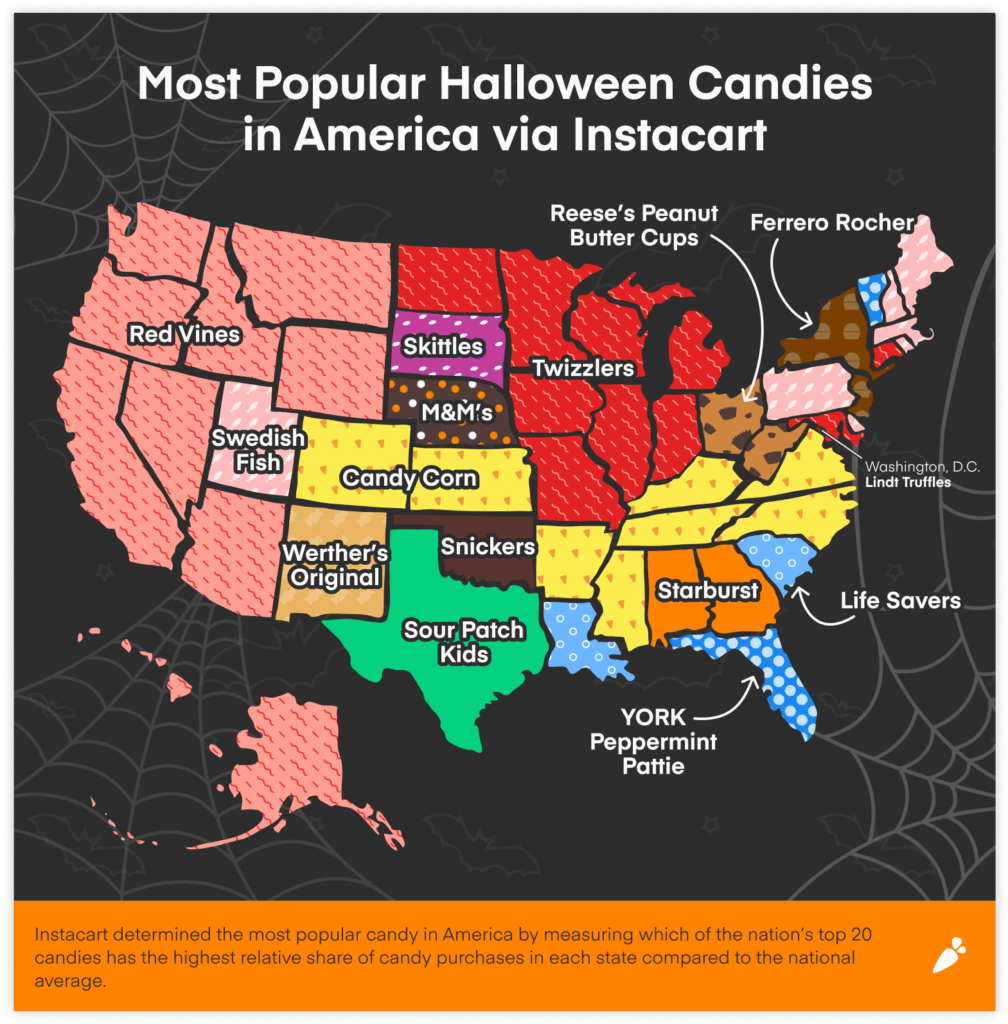
Here’s a closer look at the most bewitching candy in every state on the Instacart platform:
- Alabama – Starburst
- Alaska – Red Vines
- Arizona – Red Vines
- Arkansas – Candy Corn
- California – Red Vines
- Colorado – Candy Corn
- Connecticut – Twizzlers
- Delaware – Swedish Fish
- Florida – YORK Peppermint Patty
- Georgia – Starburst
- Hawaii – Red Vines
- Idaho – Red Vines
- Illinois – Twizzlers
- Indiana – Twizzlers
- Iowa – Twizzlers
- Kansas – Candy Corn
- Kentucky – Candy Corn
- Louisiana – Life Savers
- Maine – Swedish Fish
- Maryland – Twizzlers
- Massachusetts – Swedish Fish
- Michigan – Twizzlers
- Minnesota – Twizzlers
- Mississippi – Candy Corn
- Missouri – Twizzlers
- Montana – Red Vines
- Nebraska – M&M’s
- Nevada – Red Vines
- New Hampshire – Swedish Fish
- New Jersey – Ferrero Rocher Hazelnut Chocolates
- New Mexico – Werther’s Original
- New York – Ferrero Rocher Hazelnut Chocolates
- North Carolina – Candy Corn
- North Dakota – Twizzlers
- Ohio – Reese’s Peanut Butter Cups
- Oklahoma – Snickers
- Oregon – Red Vines
- Pennsylvania – Swedish Fish
- Rhode Island – Swedish Fish
- South Carolina – Life Savers
- South Dakota – Skittles
- Tennessee – Candy Corn
- Texas – Sour Patch Kids
- Utah – Swedish Fish
- Vermont – YORK Peppermint Patty
- Virginia – Candy Corn
- Washington – Red Vines
- Washington, D.C. – Lindt Truffles
- West Virginia – Reese’s Peanut Butter Cups
- Wisconsin – Twizzlers
- Wyoming – Red Vines
What’s more, here are the states that buy the most and least amount of candy for Halloween according to Instacart purchase data.
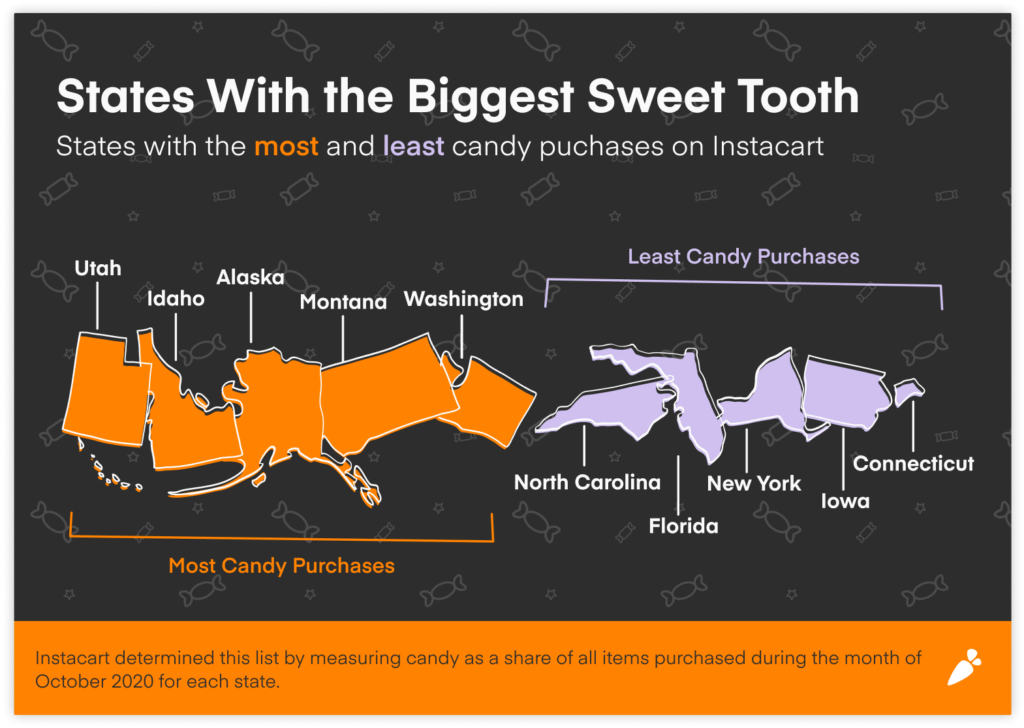
With Utah, Idaho, Alaska, Montana, and Washington topping the list for the most candy purchases on the Instacart platform, it appears that western and northwestern states have a definitively bigger sweet tooth than its counterparts east of the Mississippi with states like North Carolina, Florida, New York, Iowa, and Connecticut buying the least amount of candy for Halloween.
Why are we buying so much candy?
Is it for trick-or-treaters, the office candy bowl or…your own guilty pleasure? 😏
According to our Harris Poll survey, we’re buying a lot more candy for ourselves than we may want to believe. Among Americans who plan to buy Halloween candy this year, roughly 2 in 3 (65%) are planning to buy candy for trick-or-treaters on Halloween night, while more than half (51%) will be buying candy for themselves.
Here are some Halloween candy confessions from our survey to jumpstart your sugar cravings:
- Stealing from the kids… – Among parents with kids under age 18, 34% have admitted to stealing their kids’ Halloween candy before. When it comes to sneaking candy this year, more than half of parents of kids under 18 (53%) say they’re either absolutely or probably going to do it.
- …and not feeling guilty – More than half of parents of kids under 18 (56%) say they would not feel very or at all guilty if they snuck candy from their kid’s trick-or-treat basket, with 32% saying they would not feel at all guilty doing so. Only 17% would feel very guilty sneaking their kids’ candy.
- November candy haul – 40% admit they have bought Halloween candy after October 31st when it goes on sale. BOGO!
- A month-long sugar kick – 36% admit they have snacked on Halloween candy the entire month of October.
- Enough for leftovers? – 33% say they have purposely bought too much Halloween candy because they wanted there to be leftovers.
And if you’re not jumping off your broomstick yet, we’re serving up some shriek-worthy trick-or-treat truths:
- Not in our neighborhood – Among parents who have taken their kids trick-or-treating, 41% say they always go to another neighborhood. Only 12% stay close to home and admit to never going to another neighborhood.
- Quick, turn off the lights! – 23% admit to pretending to not be home on Halloween so they didn’t have to pass out candy.
- Healthy snacks, anyone? – More than 1 in 10 Americans (11%) have passed out healthy snacks instead of candy on Halloween. The horror!
America’s seemingly most controversial candy: candy corn
Whether you love it or hate it, chances are you probably have an opinion about candy corn.
According to our survey, here’s how Americans feel about eating the festive, sugary treat:
- L-O-V-E – 35% say they love eating candy corn
- Meh – 41% say they could take it or leave it
- Hate is a strong word – 21% say they hate eating candy corn
- A bit unbelievable but… – 3% have never tried it
Younger adults (ages 18-44) are more likely than those ages 65+ to say they love eating candy corn (39% vs. 28%), making the case that some traditions clearly do not stand the test of time.
Mom and dad are also pretty corny. Parents with kids under age 18 are more likely than those without kids in the same age range to say they love eating candy corn (44% vs. 30%).
Curious which parts of the country like candy corn the most? We’ve got you covered…
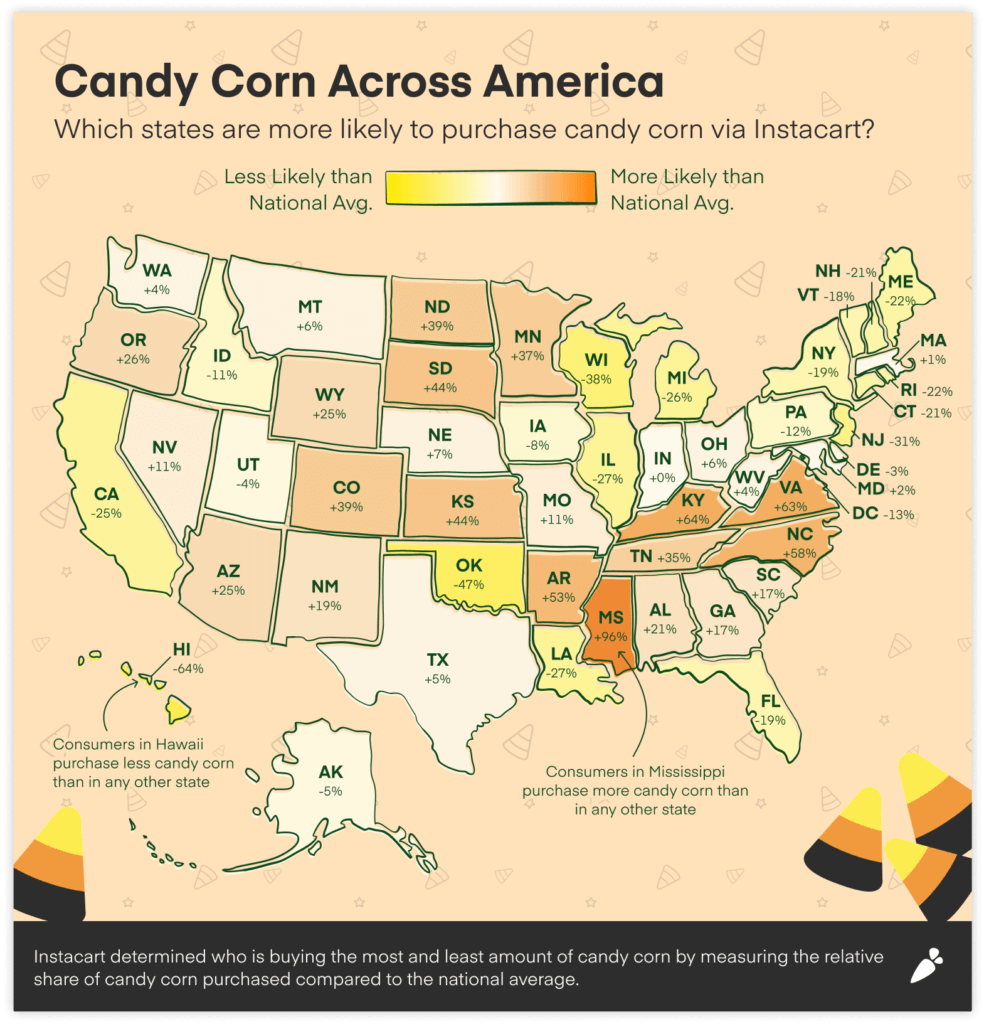
According to the candy corn heat map, these states are more likely to purchase candy corn compared to the national average:
- Mississippi (+96%)
- Kentucky (+64%)
- Virginia (+63%)
- North Carolina (+58)
- Arkansas (+53%)
Meanwhile, people living in these states are the least likely to purchase candy corn:
- Hawaii (-64%)
- Oklahoma (-47%)
- Wisconsin (-38%)
- New Jersey (-31%)
- Illinois (-27%)
TL;DR: Mississippians are all-in on candy corn, while residents of the Aloha state are likely too busy enjoying summer-like weather to get caught up in seasonal trends.
Happy Halloween, everyone! Whether or not you’re trick-or-treating, we hope you still load your Halloween baskets with candies and confections for a spook-tacular time!
Survey Method:
This survey was conducted online within the United States by The Harris Poll on behalf of Instacart from September 21-23, 2021 among 2,063 adults ages 18 and older. This online survey is not based on a probability sample and therefore no estimate of theoretical sampling error can be calculated. For complete survey methodology, including weighting variables and subgroup sample sizes, please contact [email protected].
Adjusting for Growth:
We adjust Instacart growth percentages by the overall growth of total deliveries. Doing so removes the influence of our platform growth so we can focus on the change in consumer behavior.
Most Recent in Company Updates

Company Updates
From Insight to Impact: Instacart Supports New Research on Food Access and Nutrition Security
We believe that every person deserves access to nutritious food, regardless of their economic background or zipcode. Today, we’re proud to share the publication of a special issue of the Journal of Healthcare for the…...
Nov 20, 2024
Company Updates
Instacart expands its fight against food insecurity this holiday season
At Instacart, we aim to create a world where everyone has access to nutritious food and essentials they need. In pursuit of this goal, we recognize that as a company at the center of millions…...
Nov 18, 2024
Company Updates
Holiday “Express Lane” Feature Delivers Cheer to Instacart+ Members with $10 Cart Minimums for $0 Delivery
Spirited Savings Abound With $0 Delivery– Even on Small Orders of Just One or Two Items Today, Instacart is rolling out a new perk for members for the 2024 holiday season: Express Lane. With Express…...
Nov 18, 2024

 Instacart’s Impact on America’s Grocery Industry, by the Numbers
  Breaking Down Barriers to Food Access with EBT SNAP Expansion
  Beyond the Cart: A Year of Essential Stories
  A Hot Take on America’s Favorite Hot Sauces 🌶
  JuJu Smith-Schuster: What’s in my Cart?
  Introducing the First-Ever Instacart Emerging Brand List
