Instacart Ads
Consumer Insights — A Look at Dry January
As the leading online grocery platform in North America, powered by one of the largest digital grocery catalogs in the world, Instacart is able to offer brand partners insights on consumers’ online shopping patterns across the United States. The insights are anonymized and available via our Customer Intelligence Platform.
This data includes insights into what consumers are buying, how they’re finding what they buy, what items are commonly found together in baskets, and trends over time as their shopping habits evolve, among brand-specific data on category share, conversion rates, and other useful metrics. By analyzing this data we can uncover interesting consumer trends and insights, which we’ll periodically share in our Consumer Insights series.
In their article ‘New Surveys Indicate Increasing Interest in Dry January’, Forbes reported that one in seven Americans surveyed participate in Dry January and abstain from drinking alcohol in January. We wanted to know if our data backed that up or if, like making a New Year’s resolution with the best of intentions only to abandon it a few weeks in, were consumers adding alcoholic beverages to their Instacart orders at similar rates? Our hypothesis was that with lockdowns and other pressures, many who normally participated in Dry January might skip this year’s and keep treating themselves — after all, toasting the weekend is something we can still enjoy in lockdown.
To help answer this question and understand the consumer trends around Dry January, first we gathered data on the total amount of dollars being spent on beverages during January 2020, December 2020, and January 2021, and broke this into non-alcoholic and alcoholic groups to see what percentage was alcoholic. We call this metric ‘Share of Thirst’ and it shows the impact of Dry January.
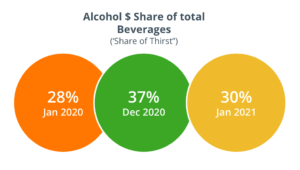
This data shows a couple of things. One, alcohol’s share of thirst does decrease during Dry January. And two, it decreased less in 2021 than in 2020. This suggests there’s something to both Dry January and our hypothesis that during COVID some consumers who would normally drink less (or not at all) during January are continuing to imbibe.
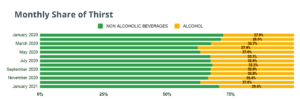
Looking at the share of thirst during the period from January 2020 to January 2021 we see alcohol’s share was the lowest in January 2020, rising to a peak in April and May, leveling off, and then dropping significantly in January 2021.
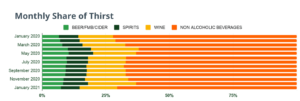
Peering in a little deeper, we can break the ‘Alcohol’ group of beverages down into its sub-categories, and see that wine has the largest Share of Thirst in the alcohol group.
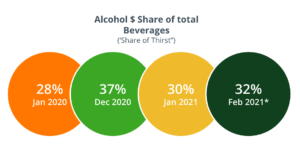
As of late February, alcohol’s share of thirst had gone up 4%, back to 32%. This data supports the idea that the January drop correlated to Dry January or New Year’s resolutions and did not represent a long-term behavioral shift.
Healthier options replacing alcohol during January
So, what was taking up the Share of Thirst alcohol lost in January? We’d expect many sub-categories within this group to grow compared to December. And they did — but not evenly. The data suggests consumers were trading in alcohol for healthier options when they bought beverages.
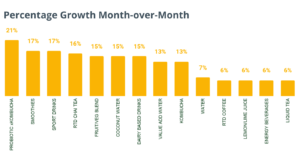
Probiotics, smoothies (especially green blends), fruit/vegetable juice blends, and coconut water all had double digit growth, month-over-month (MoM). While alcohol declined 26% MoM. To account for surging demand during COVID-19, where the Instacart Marketplace saw a dramatic surge in the number of orders and users, we looked at YoY growth for beverages compared to alcohol’s growth. With alcohol growing by 250% compared to January 2020, any beverage growing more than 250% YoY was gaining share.
What we found was that compared to January 2020, customers were increasingly drinking more apple cider and tonic water as their replacement beverage.
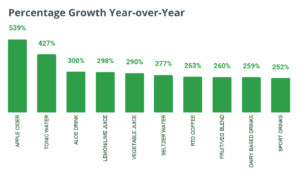
Notice Sport Drinks grew 252% year over year — just barely outpacing alcohol’s growth by 2 points. During the pandemic there have been fewer activities linked with sports drink consumption happening, like going to the gym or participating in team sports, which has likely challenged this category which sees a lot of its purchases around these usage occasions.
Mix of spirits shifts to wine & beer in Jan away from cocktails
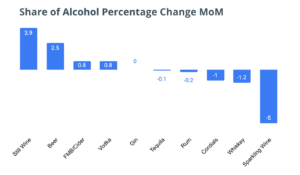
While January did see a dip in alcohol’s Share of Thirst, some sub-categories grew their share of the category in January MoM. We saw consumers gravitating towards beer and wine and away from spirits and more celebratory options like sparkling wine.
Dreaming of tropical destinations…
As travel continues to be limited during the COVID-19 pandemic, customers are finding ways to emulate warm weather getaways at home. While virtually all cocktail mixers sales declined in January MoM, Strawberry Margarita Mixers & Mango Daiquiri/ Margarita Mixers grew close to double digits.
Even outside of alcohol, customers are gravitating towards tropical options — Tropical Fruit Mixes & Avocados accounted for 2 of the 3 fastest growing fruit categories month over month.
Look what’s brewing
When looking at the impact of Dry January on consumer trends on the Instacart Marketplace, non-alcoholic beer occupies a unique position — it can be considered part of the beer category while potentially also seeing a boost from consumers switching to non-alcoholic beverages.
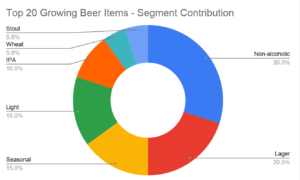
Small, but mighty — Non-alcoholic beer accounted for 3.0% of total Beer sales volume in January 2021, and drove more than its fair share of growth (3.6% of category growth compared to last January). The non-alcoholic beer segment grew by 16.2% in January 2021 vs. December 2020.
Not just a passing fad — Non-alcoholic beer’s share of total beer has climbed steadily month over month in 2020 after starting at only 1.2% share in January 2020, proving its relevance beyond Dry January.
A massive opportunity — Non-alcoholic beer SKUs account for only 1.5% of all the SKUs in the beer category, but 30% of the top 20 SKUs by absolute growth MoM. Brands in this space can compete with a smaller amount of SKUs for a relatively larger amount of growth.
Gain access to the insights and analytics you need
That’s a wrap on our first entry in the Consumer Insights series, where we take a look at some interesting trends our team has uncovered. While this deep-dive was an example of custom reporting, it utilized the same rich and massive data set available to our brand partners through our Customer Intelligence Platform in an attempt to highlight the value of the platform and its data.
Advertise with us to get in front of consumers when they’re searching for products like yours on the Instacart Marketplace. For more information and to get started, visit ads.instacart.com.
Most Recent in Instacart Ads

Instacart Ads
New Studies Show Instacart Ads Influencing In-Store Purchases
New Circana case studies show in-store sales lift when CPGs advertise on Instacart Brands advertise with Instacart at the point of purchase to reach a high-intent audience while they shop online at their favorite retailer…
Dec 17, 2024
Instacart Ads
Ibotta x Instacart Webinar
Recently, Instacart and Ibotta recorded a new joint webinar, titled 'Better Together: The Power of Ibotta & Instacart.' Hosted by Kelly Owens, VP of Client Partnerships at Ibotta and Jen Meyer, Senior Sales Director at…
Dec 10, 2024
Instacart Ads
Instacart Extends Ads Academy To Canada
Instacart has extended its Ads Academy into Canada, offering tailored training and certification for Canadian brands and agencies to improve their campaign performance on Instacart. Ads Academy provides a self-serve, self-paced online learning environment. The…
Dec 3, 2024

 How Consumers Shop on Instacart – Unique Consumer Behavior
  Advertising on Instacart 101: Where Do My Ads Show?
  How Instacart Ads provides value today and in the cookieless future
