Company Updates
Savor the Flavors: An Herbs and Spices Showdown
On the heels of National Herbs and Spices Day (June 10), we couldn’t resist delving into the wonderful world of culinary seasonings. After all, what’s food without a burst of flavor? From the fragrant yet polarizing allure of cilantro to the fiery kick of chili powder, we’re revealing the top fresh and dried herbs and spices that are enhancing kitchens across the nation.
Herbaceous Heroes: The Top 10 Herbs and Spices
According to a recent Instacart survey of over 2,000 American adults conducted online by The Harris Poll, most Americans (94%) cook with herbs and spices, and 75% do so at least 2-3 times a week or more often. This overwhelming preference for herbs and spices highlights the crucial role they play in elevating everyday cooking, transforming ordinary meals into a culinary experience…
So we took a look at Instacart’s purchase data to uncover the 10 most popular fresh and dried herbs and spices, revealing quite the flavor-packed lineup:
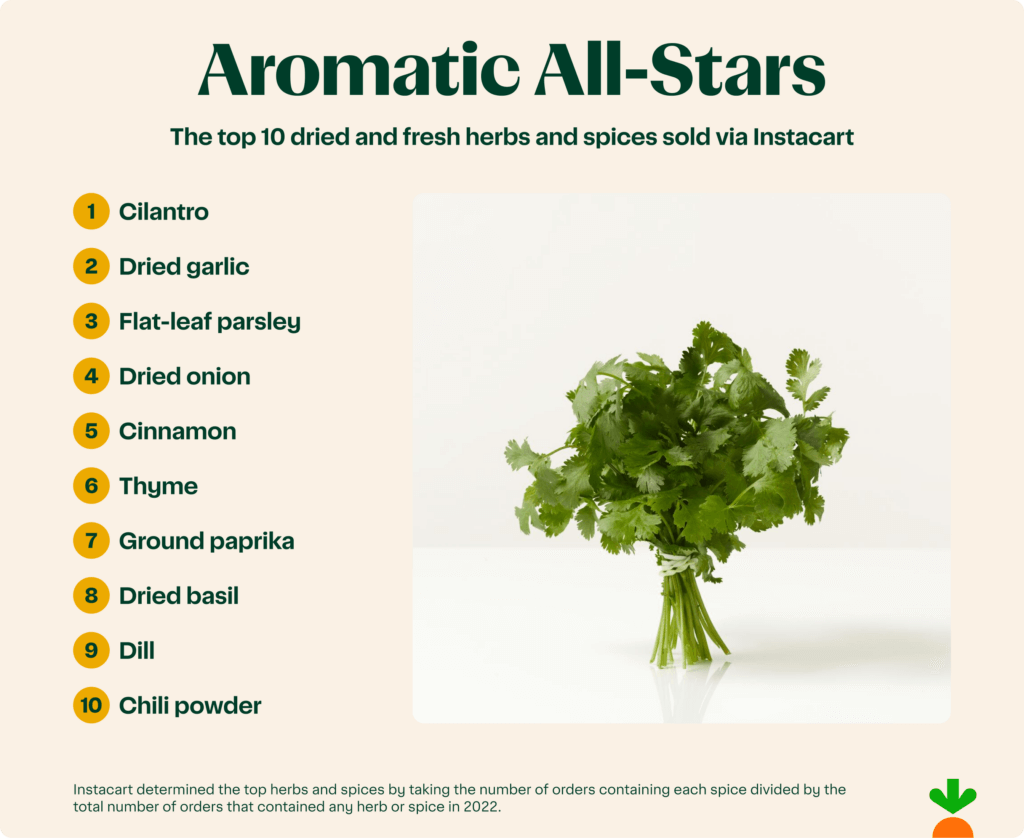
Based on our survey conducted by The Harris Poll, it’s fascinating to note that a majority (61%) of herb-cooking enthusiasts express an equal fondness for both fresh and dried varieties. With this in mind, it comes as no surprise that our top 10 list of herbs and spices purchased via Instacart reflects a nearly even distribution between the two categories. Let’s break it down…
- 💦Fresh to death. Starting with the 4 fresh herbs on our top 10 list, cilantro reigns supreme as the most popular herb or spice in the country at #1, with flat-leaf parsley coming in at #3, thyme at #6, and dill at #9.
- 🏜️Dry as a desert. With 6 dried herbs and spices falling on the top 10 list, we have dried garlic at #2, dried onion at #4, cinnamon at #5, ground paprika at #7, dried basil at #8, and chili powder at #10.
Cilantro: Love It or Leaf It
Let’s take a closer look at cilantro since it’s not only the most popular herb or spice, it’s also quite a polarizing one…
“Cilantro’s distinctive taste has created quite a divide. While many enjoy its vibrant notes, others recoil at its mere presence — making it a subject of passionate consumer discussions” said Laurentia Romaniuk, Instacart’s Trends Expert. “Our survey with The Harris Poll found that more than 1 in 3 Americans (35%) love cilantro and believe it tastes refreshing, while 13% dislike or hate cilantro. Further, among those who hate and cannot tolerate the taste of cilantro, 65% find its aroma equally displeasing, with 33% saying cilantro smells and tastes like soap.” 🧼
So, which states buy the most and least of this polarizing yet popular herb based on Instacart’s purchase data? Let’s take a look:
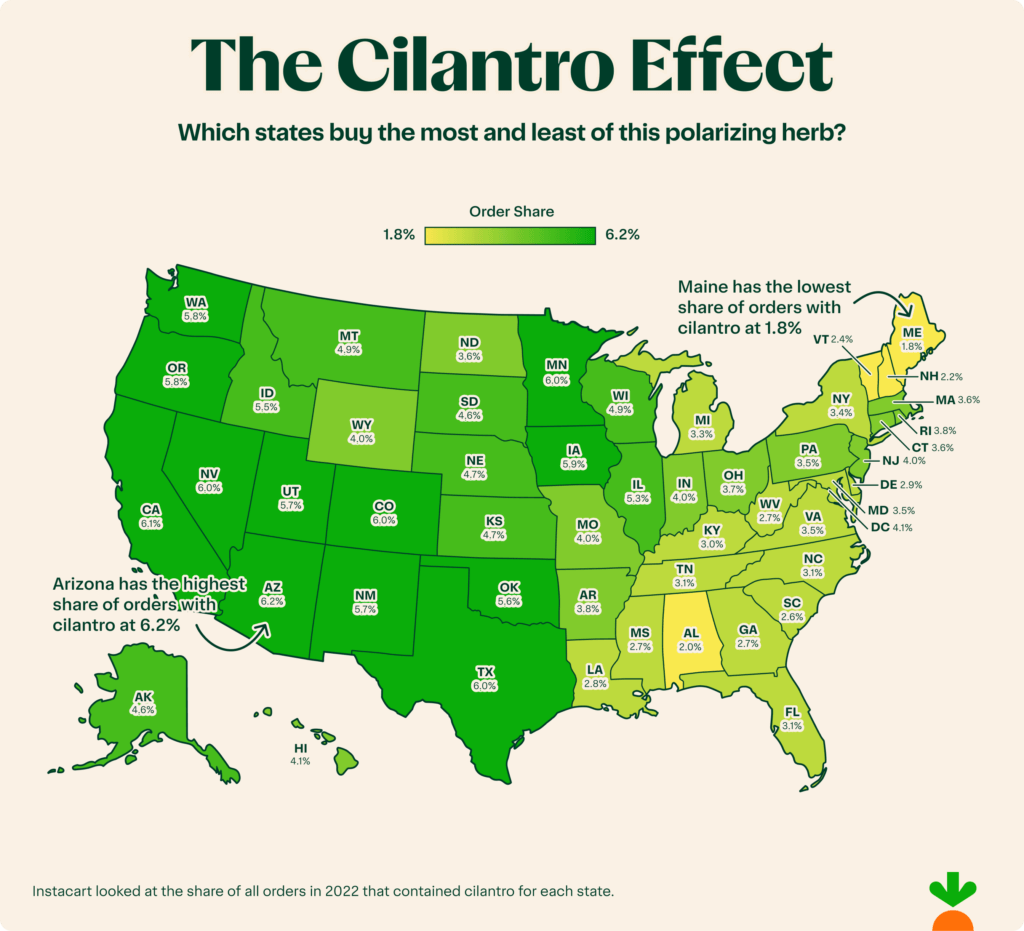
Top 5 States with the highest share of cilantro purchases:
- Arizona: 6.2%
- California: 6.1%
- Nevada: 6%
- Colorado: 6%
- Minnesota: 6%
Top 5 States with the lowest share of cilantro purchases:
- Maine: 1.8%
- Alabama: 2%
- New Hampshire: 2.2%
- Vermont: 2.4%
- South Carolina: 2.6%
State-by-State Flavor Preferences
Below, we’re revealing the most uniquely popular fresh or dried herb or spice in each state, i.e. the herb or spice that each state buys more than the national average:
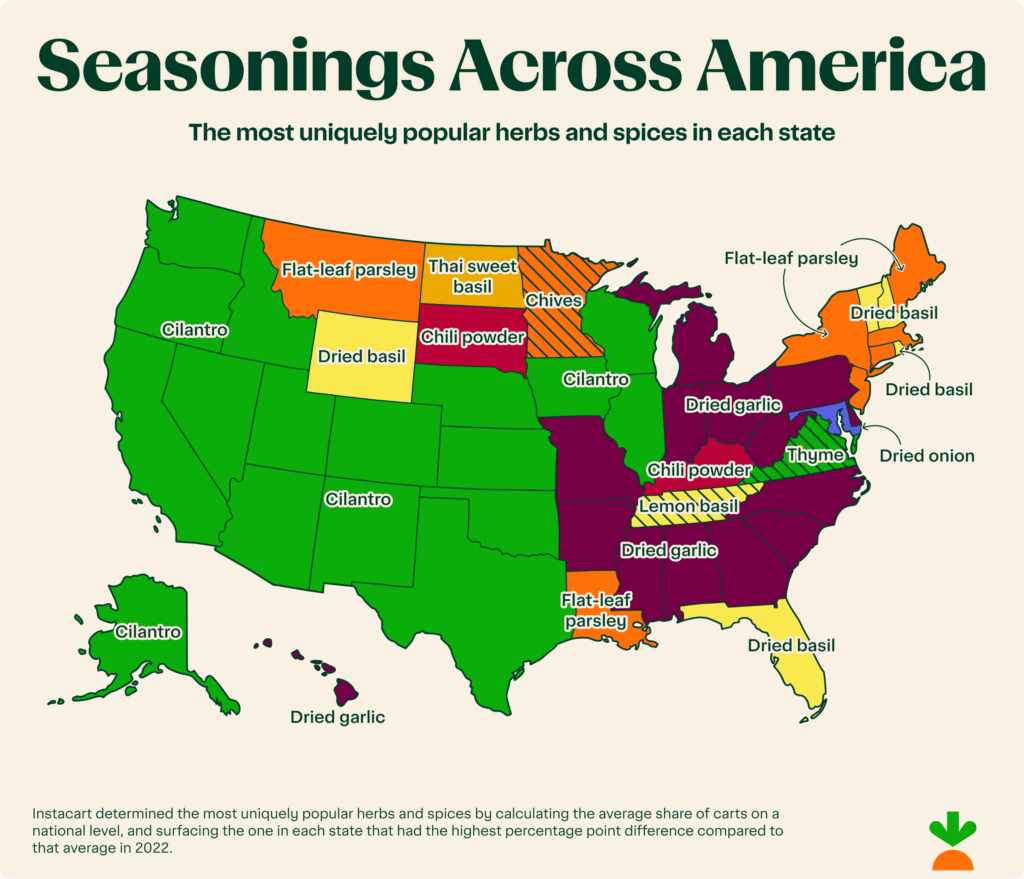
- 🌿Leafy wonders. Given cilantro is the overall most popular herb or spice in America, it’s no surprise the leafy green takes the #1 spot in 17 states. In addition, other leafy and fresh herbs make an appearance including flat-leaf parsley in 7 states and Washington DC, as well as lemon basil, Thai sweet basil, chives, and thyme in 1 state each.
- 🧄Flavor town. When it comes to dried herbs and spices, 14 states prefer dried garlic, 5 opt for dried basil, 2 like chili powder, and 1 state goes for dried onion.
Whether you love or hate cilantro, we hope your food is always packed with abundant flavor. 🧅🧂🌶️ Cheers!
Survey Method:
This survey was conducted online within the United States by The Harris Poll on behalf of Instacart from May 23-25, 2023, among 2,049 adults ages 18 and older. The sampling precision of Harris online polls is measured by using a Bayesian credible interval. For this study, the sample data is accurate to within + 2.7 percentage points using a 95% confidence level. For complete survey methodology, including weighting variables and subgroup sample sizes, please contact [email protected].
Adjusted for Growth:
We adjust Instacart growth percentages by the overall growth of total orders via Instacart. Doing so removes the influence of our platform growth so we can focus on the change in consumer behavior.
Most Recent in Company Updates

Instacart Health
Making Expert Nutrition Advice Accessible and Actionable with Instacart Health
It should be easy to understand how nutritious a food is, but we’ve all been there – studying the fine print on a package, trying to figure out how it fits into our health needs…
Dec 20, 2024
Company Updates
New Solutions for Suppliers and Merchants with Instacart Business
At Instacart Business, our mission is to empower businesses of all kinds with seamless access to the fresh ingredients, snacks and business supplies they need. And over the past few months, Instacart Business has not…
Dec 16, 2024
Company Updates
Instacart Launches ‘Stress Baster’ for Holiday Hosts Feeling the Squeeze
Free Stress Baster drop gives hosts the “utensils” to cope with holiday stress and to remind you that “Yule Be Fine, man” Ah, the holidays – a time for joy, cheer, and, if you're a…
Dec 10, 2024

 Instacart’s Impact on America’s Grocery Industry, by the Numbers
  Breaking Down Barriers to Food Access with EBT SNAP Expansion
  Beyond the Cart: A Year of Essential Stories
  A Hot Take on America’s Favorite Hot Sauces 🌶
  JuJu Smith-Schuster: What’s in my Cart?
  Introducing the First-Ever Instacart Emerging Brand List
